| Quantity | 3+ units | 10+ units | 30+ units | 50+ units | More |
|---|---|---|---|---|---|
| Price /Unit | $377.30 | $369.60 | $358.05 | $342.65 | Contact US |
 V6 Multifunctional Inverter Refrigerator Detector Inverter Refrigerator Compressor Detector with Equipment Bag (Master Version)
$97.59
 V6 220V Multifunctional Inverter Refrigerator Detector Inverter Refrigerator Compressor Detector (Master Version)
$96.03
 Micsig CP1003B 100MHz 5A/30A Dual Range High Frequency AC/DC Current Probe with BNC Connector for Oscilloscope
$834.98
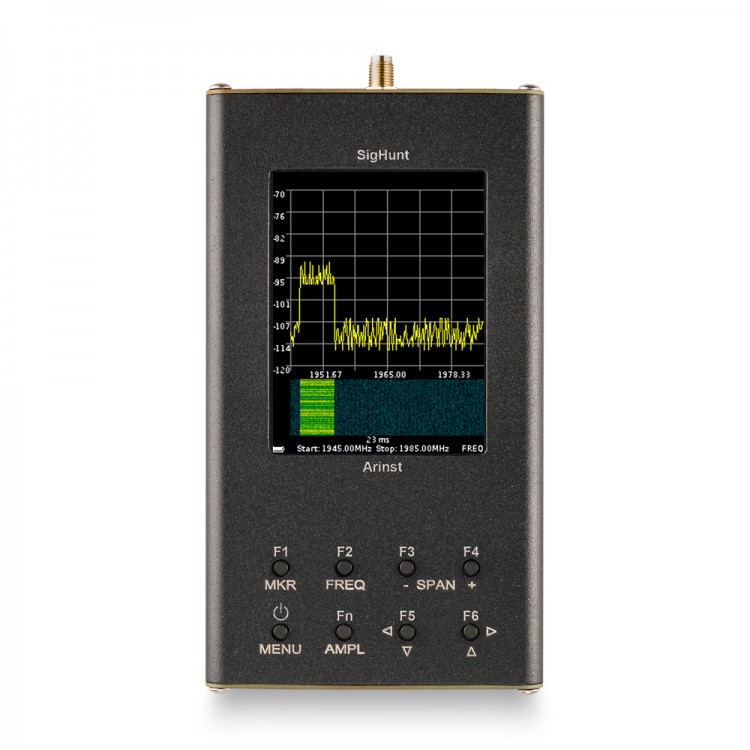
Arinst SSA R2 SigHunt RF Spectrum Analyzer 35-6200MHz Portable Signal Hunter With Touch Screen
Description:
For Arinst SSA R2 Signal Hunter is an easy portable spectrum analyzer designed to display signal spectrums in the frequency range from 35 to 6200 MHz. The device allows to determine the amplitude and frequency of the spectral components that compose the signal.
Spectrum analyzer can operate with signals for all widely used technologies: Wi-Fi, 2G, 3G, 4G, LTE, CDMA, DCS, GSM, GPRS, GLONASS etc.
Download the instructions:
Link for www.arinst.net/files/Spectrum-Analyzer-Arinst-SSA-R2-Signal-Hunter-ENG.pdf
Application:
The main purpose of the device is the detection of packet (pulsed) radio signals and radio transmitting devices of all modern communication systems. High scanning speed compared to other versions of analyzers for ARINST is achieved through the use of two frequency synthesizers. For advanced analysis, functions for displaying the time-frequency spectrum "waterfall chart" and "digital phosphorus" have been added. They are designed to observe the evolution of signals in both the frequency and time domains.
It enables service centers and maintenance teams to perform on-the-spot HF analysis for commissioning and repair works. Moreover, the spectrum analyzer is a perfect solution for repair workshops and radio amateurs.
Principle of operation:
The spectrum analyzer is a portable device that is connected to the measured circuit and has an independent power supply. The device has a 3.2" color resistive touch screen to display the signal spectrum and to control the device.
All measured data are displayed on the device screen in the real time.
Advantages:
- 3.2" color resistive display;
- wide frequency range: 35 to 6200 MHz;
- rapid scanning of the frequency range: approx. 100 µs per point;
- high measurement precision: ±0.5 dB within the dynamic range of 70-75 dB;
- high scanning speed in any span;
- waterfall chart;
- digital phosphorus chart;
- exceptionally easy to use in the field: the weight is as low as 400g, dimensions are 155х81х27 mm;
- independent supply lasts up to 3 hours of uninterrupted operation;
- power supply and charging from a stabilized source with a wide voltage range from 7 to 24 V;
- free device control firmware and its free updates (more details about the update here, link for arinst.net/download-apk.php).
Specifications:
- Displayed frequency range: 35 MHz - 6200 MHz
- Dynamic range for 35-3000 MHz band: >75 dB
- Dynamic range for 3000-6200 MHz band: >70 dB
- Maximum span: 6165 MHz
- Maximum span scan time: 3.6 s
- Bandwidth (fixed): 200 kHz
- Scan speed in the mode "Precise" : 1 GHz/s
- Scan speed in the mode "Standard": 1.5 GHz/s
- Scan speed in the mode "Fast": 2 GHz/s
- Scan time in the band 100 MHz: < 55 ms
- Min. duration of the detected signal in the scan band 50 MHz: 30 ms
- Noise floor up to 35-3000 MHz: < -110 dBm
- Noise floor 3000-4500 MHz: < -105 dBm
- Noise floor 4500-6200 MHz: < -95 dBm
- Wave impedance: 50 Ohm
- SWR in the operating frequency range: < 1.5
- Signal accuracy within dynamic range in the mode "Precise": ±0,5 dB
- Signal accuracy within dynamic range in the mode "Standard": ±1.5 dB
- Signal accuracy within dynamic range in the mode "Fast": ±2.5 dB
- Maximum input power: -25 dBm
- Maximum input measured signal: -30 dBm
- Maximum DC input voltage: 25 V
- Maximum current consumption when running on battery power: 700 mA
- Maximum current draw when running from USB (when charging): 700 mA
- Voltage range of external power supply: USB 5V 0.8A, jack 7-24V 5W
- Minimum external power supply: 4 W
- Battery: 2500 mAh
- Battery runtime: 3 hours
- Battery charging time: ~ 3 hours
- Dimensions (LxWxH): 155 x 81 x 27 mm
- Net weight: 0.4 kg
The main functions of the application for controlling the device:
· Viewing the spectrum of signals in the form of graphs with setting the frequency range and reference level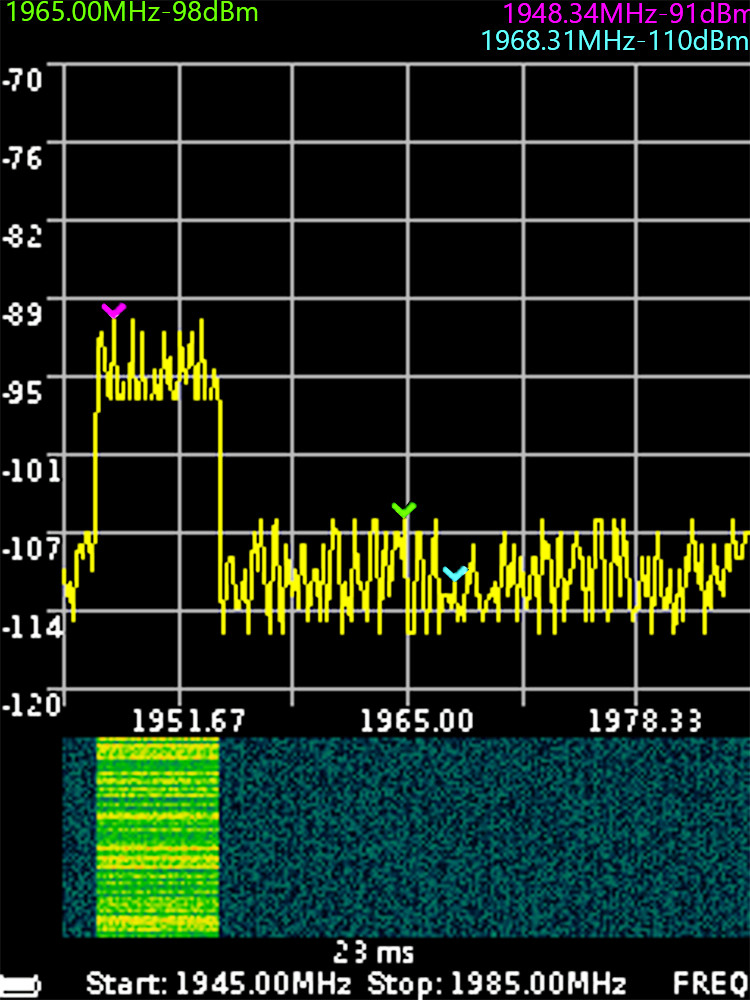
· In the additional "trace" mode the minimum signal values (green trace), maximum values (red trace) or average values (yellow trace) are displayed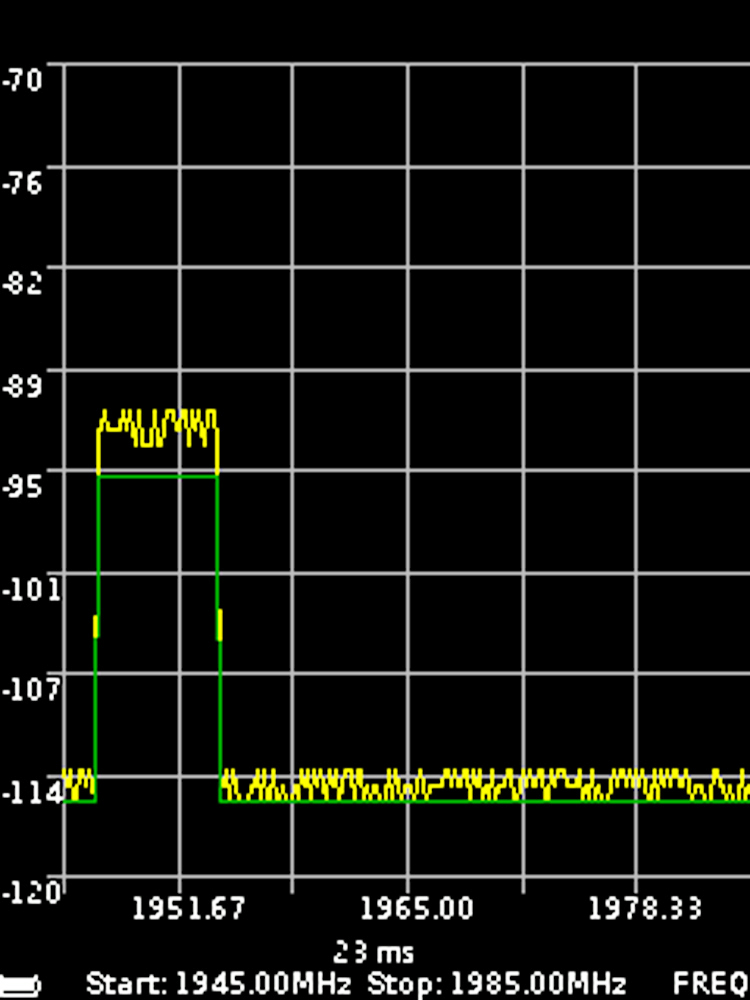
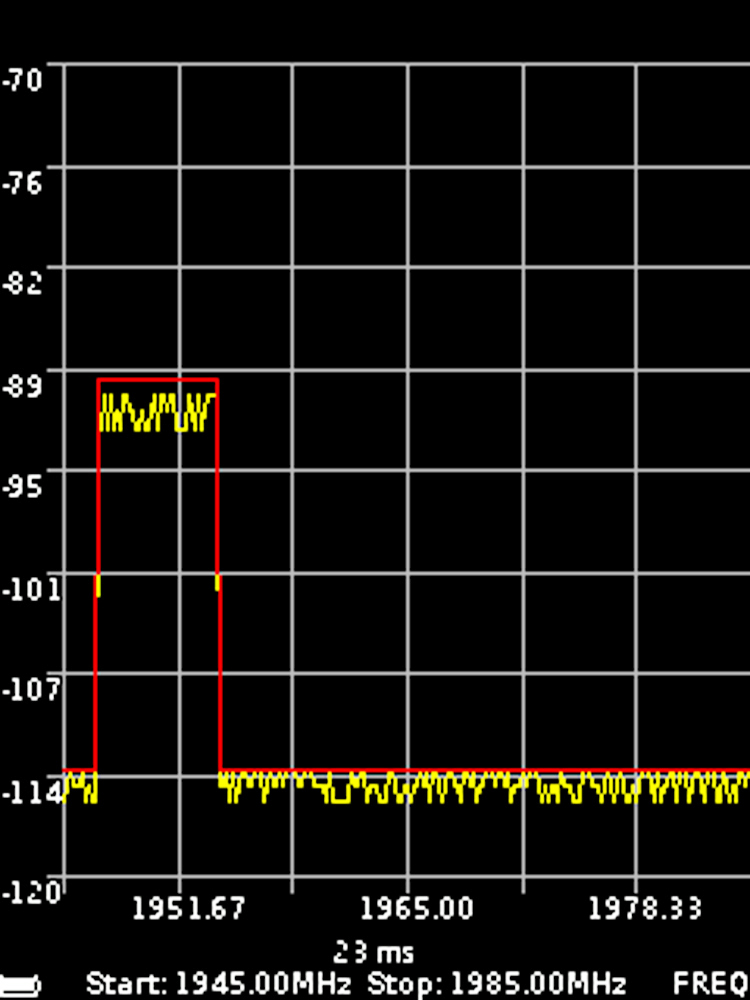
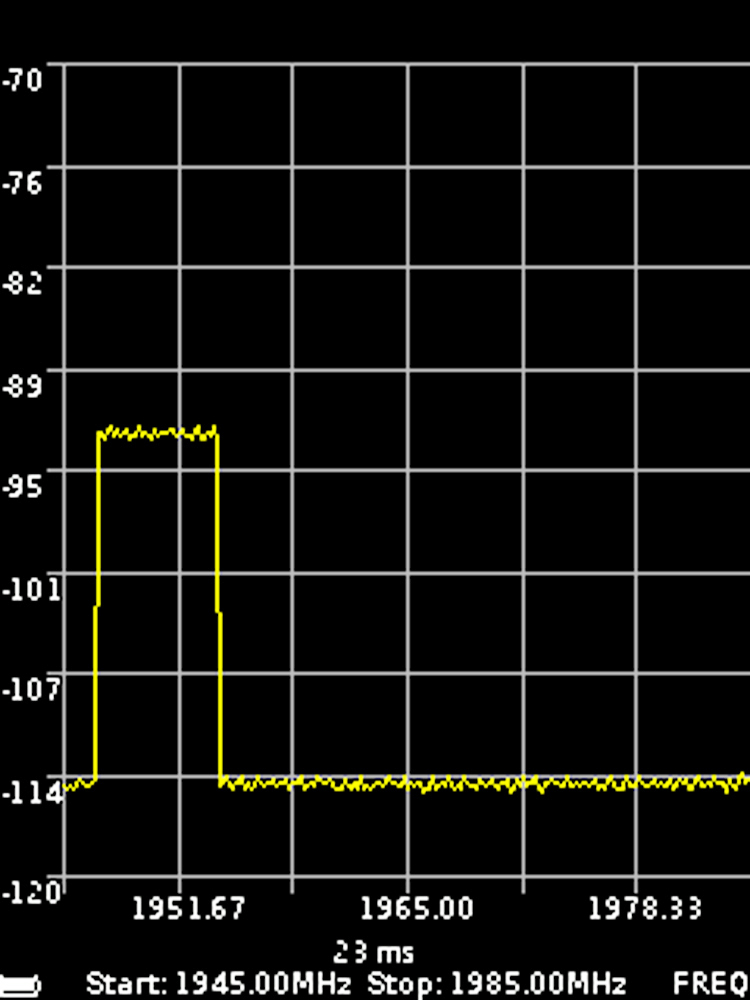
· An additional display mode of the frequency-time diagram of the signal allows to analyze the background of the signal for a certain time interval. Due to the selectivity of the color perception of a person, with the help of the frequency-time diagram it is possible to detect signals at a noise level: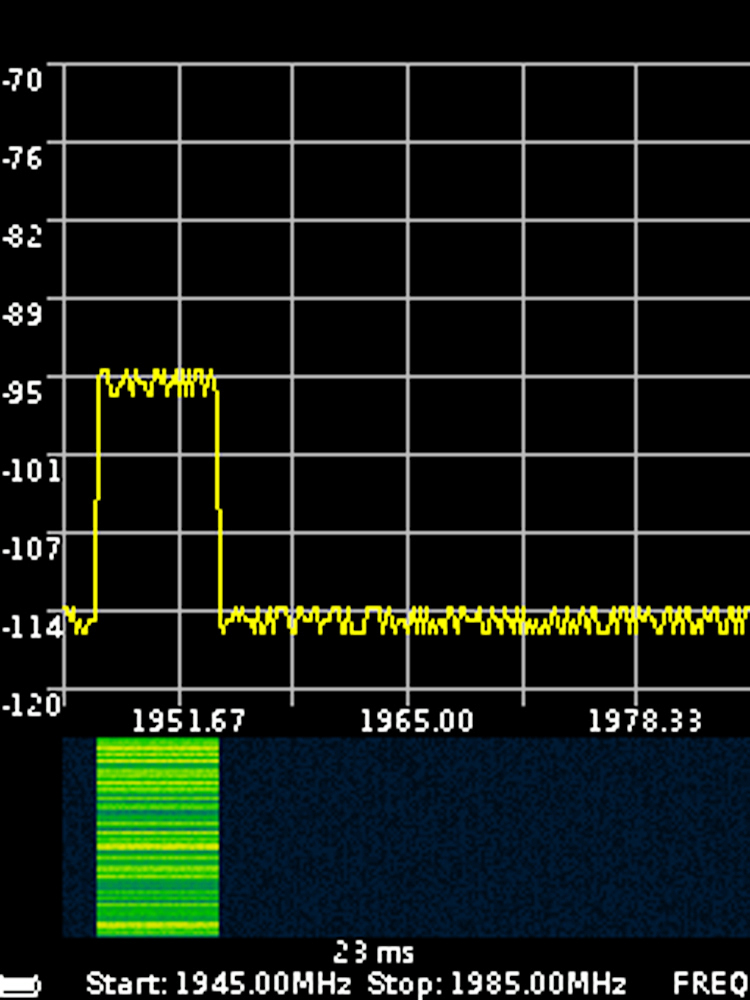
· An additional "digital phosphorus" display mode is an alternative way to visualize the time-frequency diagram, in which the signal amplitudes are displayed on a scale, and their temporal location is set in a color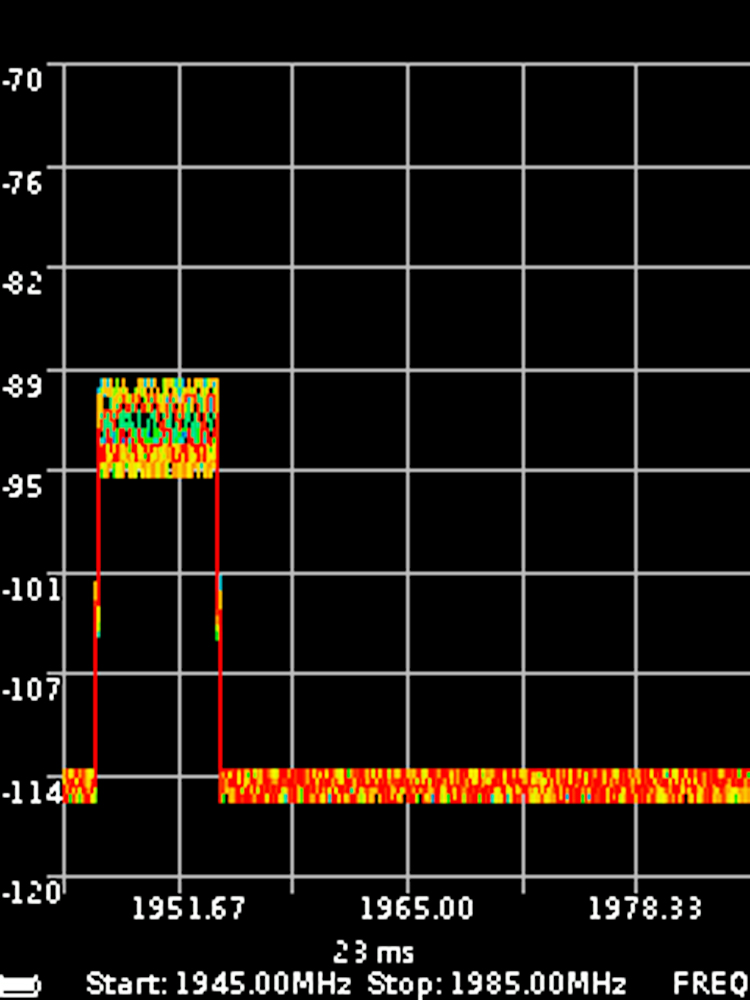
Limitations:
The spectrum analyzer is not a measuring device, since it does not have an approved pattern of the measuring instrument. The approval of the pattern of the measuring instrument would adversely affect the availability and price of the instrument. Therefore, the spectrum analyzer from an official point of view is a field indicator. However, despite this, the device fully complies with all declared technical specifications. Each instrument is calibrated by power and frequency.
The analyzer is not a sterling classical spectrum analyzer, since it does not use the classical frequency conversion circuit for 100% suppression of the mirror channel. We use mathematical suppression of the mirror channel, which in some rare cases can lead to the appearance of "phantom" signals in the displayed signals.
Package Included:
- 1 x Set of Spectrum Analyzer